Tableau interview questions go beyond “can you build a chart?” Interviewers test whether the candidate can handle messy data, slow dashboards, conflicting stakeholder requirements, and performance trade-offs. The Tableau interview questions and answers guide 2026 helps data analysts and BI professionals crack Tableau interview questions.
Tableau developer interview questions and answers cover commonly asked questions for basic, intermediate, and advanced developers. Topics covered in the interview questions in Tableau include LOD expressions, data blending, context filter, optimization techniques, performance tradeoffs, and many more.
Key Takeaways
- Tableau interview questions examine your expertise in solving complex business problems.
- The technical depth of the interview questions tableau varies for beginners, intermediate, and expert developers.
- Tableau developer interview questions are on using different file extensions and their contents.
- Expect deep questions on filters, chart types, parameters, calculated fields, LoD, optimizing dashboards, and several other core topics.
- Practice with problems and coding with Python, register for interview preparation courses, and take mock interviews.
Basic Tableau Interview Questions
This section presents foundational concepts asked in almost every Tableau interview question for all roles or seniority.
Q1. What is Tableau, and what problem does it solve?
Tableau is used for data visualization and business intelligence. It analyzes raw data from several sources and transforms data into interactive dashboards and reports without difficult coding. The business problem that Tableau solves is explaining large, complex datasets in simple forms, allowing for faster data-driven decision-making without any programming expertise.
Q2. What are the main Tableau products, and when would you use each?
Tableau has several products, and each is used for a specific purpose. The following table presents Tableau products, what they are, and when to use them.
| Product | What It Is | When You Use It |
|---|---|---|
| Tableau Desktop | Authoring tool for creating dashboards, reports, and visualizations locally | When analysts need to connect to data, build complex dashboards, and perform deep data analysis |
| Tableau Server | An on-premises platform to publish, share, and manage Tableau content within an organization | When you need centralized control, security, and internal sharing of dashboards behind a firewall |
| Tableau Cloud (Online) | Fully hosted SaaS version of Tableau Server managed by Tableau | When you want to avoid infrastructure management and enable secure, scalable access over the internet |
| Tableau Public | Free platform to create and publish visualizations publicly on the web | When sharing open data, portfolios, or public-facing dashboards with no data privacy concerns |
| Tableau Prep | Data preparation tool for cleaning, shaping, and combining data before analysis | When raw data needs transformation, joining, or cleansing before being used in Tableau dashboards |
Q3. What is the difference between a dimension and a measure in Tableau?
A dimension is a categorical field, such as region or product, and it is used to slice and group data, defining how data is organized in a chart. A measure is a numeric field, such as sales or profit, and Tableau aggregates it into sums, averages, and other values to produce the values plotted against those dimensions.
Q4. What is the difference between a live connection and an extract in Tableau?
A live connection is used to query a data source in real time, so dashboards always show the latest data but depend on source performance. An extract is a snapshot of data stored in Tableau’s optimized in-memory engine. It improves performance and allows offline analysis, but needs a refresh to stay up to date.
Choose live when real-time, frequently changing data is needed. Choose extract for faster performance, large datasets, or limited source connectivity.
The following table compares live vs. extract features.
| Feature | Live Connection | Extract |
|---|---|---|
| Data freshness | Real-time; always reflects the latest source data | Snapshot: requires scheduled/manual refresh |
| Performance | Depends on the source system performance | Faster; uses an in-memory optimized engine |
| Works offline? | No | Yes |
| Best for | Frequently changing, real-time dashboards | Large datasets, faster queries, limited connectivity |
Q5. What file extensions does Tableau use and what does each one contain?
The following table gives file extension, the full form, and what the file contains.
| Extension | Name | What It Contains |
|---|---|---|
| .twb | Tableau Workbook | XML file with metadata, sheets, and connections (no data). |
| .twbx | Tableau Packaged Workbook | Zipped workbook with. twb plus embedded data, extracts, and assets. |
| .tds | Tableau Data Source | Connection info and metadata (no actual data). |
| .tdsx | Tableau Packaged Data Source | Zipped .tds with embedded extracts and supporting files. |
| .hyper | Tableau Extract | High-performance columnar data extract used by Tableau engine. |
| .tfl | Tableau Flow | Flow definition for Tableau Prep (steps, no data). |
| .tflx | Tableau Packaged Flow | Flow with embedded data files and connections. |
Q6. What are the different types of filters in Tableau and in what order do they run?
Different types of filters are given in the order:
- Extract Filters
- Data Source Filters
- Context Filters
- Dimension Filters
- Measure Filters
- Table Calculation Filters
Top N Filters are applied with dimension filters after the context is set. The order matters since each step reduces the dataset for the next. Earlier filters, like context, directly affect the results and performance of later filters like Top N and table calculations.
Q7. What is the difference between a join and a blend in Tableau?
A join integrates tables at the row level in the same data source with keys, creating a single, flattened dataset before analysis. A blend combines data from multiple data sources at the aggregate level in the view, linking them via common fields after queries run separately. Use a join when data is in the same source and needs row-level integration; use a blend when sources differ or can’t be directly joined, and you only need an aggregated comparison.
Q8. What chart types does Tableau support, and when would you use a treemap vs a heatmap?
The common chart types are bar, line, area, scatter plot, pie, histogram, box plot, treemap, heatmap, map (symbol/filled), Gantt, bullet, and dual-axis charts. A treemap uses nested rectangles sized by measures to show part-to-whole relationships and hierarchy, such as category, subcategory, and contribution. A heatmap uses a grid of colored cells to show magnitude or intensity across two dimensions, useful for spotting patterns, correlations, or hotspots such as time vs category.
Q9. What are sets and groups in Tableau?
Groups integrate several dimension members into a single labeled category, such as merging “NY” and “New York” into one value, simplifying and cleaning categorical data. Sets are dynamic or fixed subsets of data defined by conditions or top/bottom rules, such as top 10 customers by sales, letting you segment and compare “in vs out” of the set.
Use groups to clean or consolidate categories, and use sets for flexible segmentation, comparisons, or conditional logic in analysis.
Q10. What is a calculated field in Tableau?
A calculated field is a custom field created with a formula to transform or derive new data, such as Profit is equal to Sales less Cost. It lives in the data pane beside dimensions and measures, and can be reused across worksheets just like any other field.
Q11. What is a parameter in Tableau, and how does it differ from a filter?
A parameter is a user-controlled input of a single value that provides calculations or logic, such as a top N parameter set to 10. A filter directly limits the data shown in a view based on conditions, such as filtering regions equal to West to display only West data.
Q12. What data sources can you connect to in Tableau?
Tableau links to several data sources, and these are:
- Files: Excel, CSV, Text, JSON, PDF
- Databases: MySQL, PostgreSQL, SQL Server, Oracle
- Cloud & SaaS: Google BigQuery, Snowflake, Amazon Redshift, Salesforce, Google Analytics
- Big Data & Others: Hadoop, Spark, SAP HANA, Web Data Connectors, API.
Intermediate Tableau Interview Questions
Tableau interview questions for the intermediate level test whether the candidate has actually used Tableau to solve real problems, not just learned it from a tutorial.
Q13. What is data blending in Tableau, and when would you use it instead of a join?
Data blending in Tableau lets you bring together data from different sources in a single view by connecting them through a common field, rather than actually merging the data. It’s especially handy when your data sits in separate systems or has different levels of detail that don’t work well with joins.
The downside is that it can be less flexible and a bit slower, since some calculations are limited and everything depends on one main (primary) data source.
Q14. What are the different types of joins available in Tableau?
Tableau supports all joins, such as inner, left, right, and outer joins, to combine data based on matching keys. The following table presents different joins, what they return, and their use.
| Join Type | What It Returns | When to Use It |
|---|---|---|
| Inner | Only matching rows from both tables | When you need records that exist in both datasets |
| Left | All rows from left table + matching rows from right | When left table is primary and you want all its data |
| Right | All rows from right table + matching rows from left | When right table is primary and you want all its data |
| Full Outer | All rows from both tables, matching where possible | When you want a complete view of both datasets |
| Cross | Every row from left combined with every row from right (Cartesian product) | When you need all possible combinations (use cautiously) |
Q15. What is the difference between a calculated field and a table calculation in Tableau?
A calculated field is created in advance; it becomes part of the data and can be used anywhere in the analysis. A table calculation is done on the fly inside a chart, working on the already summarized numbers displayed. Calculated fields are reusable and more flexible, while table calculations are great for quick, view-specific tasks like running totals or rankings.
Q16. What is a context filter, and why would you use one?
A context filter in Tableau acts as a primary filter that runs first, narrowing down the data so all other filters work on that smaller subset. For example, if you first filter to a specific region, any further filters (like product category) will only apply within that region, making results faster and more relevant.
Q17. How do you handle null values in Tableau?
In Tableau, you can deal with null values in three simple ways: remove them, replace them, or label them clearly. You can filter them out if they’re not useful, use functions like ZN or IFNULL to swap them with something like 0, or show them as “Unknown” so the data still makes sense.
Q18. What is the difference between continuous and discrete fields in Tableau?
In Tableau, continuous fields show a flowing range of values and draw an axis like a timeline of sales, while discrete fields break data into separate buckets and create headers like regions or product categories.
For example, a date displayed as a full timeline is continuous, but if you split it into months like Jan, Feb, and Mar, it becomes discrete.
Q19. What are reference lines and reference bands in Tableau, and when would you use them?
Reference lines in Tableau are drawn across a chart to mark a key value like an average or target, while reference bands are shaded areas that show a range between two values.
They make it easier to quickly compare your data against benchmarks or ranges.
For example, you could add a line for a sales target or use a band to show the safe performance range.
Q20. How do you create a dual-axis chart in Tableau?
The steps are:
- Add your first measure to the view, then drag the second measure onto the same area until Tableau lets you place it on a second axis.
- Right-click the second measure (or axis) and select “Dual Axis” to combine them in one chart.
- Tweak the chart types and sync the axes if needed so the comparison is easy to read.
Q21. What is the difference between a workbook (.twb) and a packaged workbook (.twbx)?
A .twb file is just the workbook structure; it keeps your charts, layout, and data connections, but not the actual data.
A .twbx file is a packaged version that bundles the workbook together with the data and any related files.
Use. twb when others can access the same data source, and .twbx when you need to share everything in one ready-to-open file.
Q22. How do you create a hierarchy in Tableau, and why is it useful?
In Tableau, a hierarchy is created by grouping related fields like Country, State, and City so you can move up or down levels of detail in a chart.
This makes analysis smoother; for example, you can view sales at the country level and then drill down step by step to see state or city-level details.
Q23. What is Tableau Prep, and how does it differ from Tableau Desktop?
Tableau Prep is where you tidy up and shape your raw data, fixing issues, combining sources, and getting it into a usable format. Tableau Desktop is where you turn that data into charts and dashboards.
Consider Prep as the setup stage and Desktop as the analysis and storytelling stage. Use Prep when your data isn’t clean or structured enough to work with directly.
Q24. How do you use custom SQL in Tableau?
Custom SQL in Tableau lets you write your own query to decide exactly what data gets pulled in, whether that’s filtering, joining tables, or shaping the data upfront. This is a concept often discussed in SQL interview questions for data analysts because it gives you more control over the dataset before it even reaches your charts.
The trade-off is that it can slow things down and limit flexibility, since Tableau treats it as a fixed query and can’t optimize it as easily.
Advanced Tableau Interview Questions
This section presents tableau interview questions and answers for senior analysts and BI engineers. The questions test deep Tableau knowledge, architectural thinking, and the ability to handle complex data problems.
Q25. What are LOD (Level of Detail) expressions in Tableau, and what are the three types?
Level of Detail (LOD) expressions in Tableau let you decide the level at which a calculation should happen, regardless of how the data is currently displayed. They are used when you need values calculated at a different level, either more detailed or more summarized than what you see in the view.
The following table presents LOD expression types.
| Type | What It Does | Simple Example |
|---|---|---|
| FIXED | Calculates a value at a specific level of detail, ignoring what’s in the view | Total sales per region, even if the view shows sales by city |
| INCLUDE | Adds extra detail to the calculation beyond what’s in the view | Average sales including customer level, even if the view shows region-level |
| EXCLUDE | Removes a level of detail from the calculation | Total sales excluding city, even if the view is broken down by city |
Q26. What is the difference between FIXED LOD and a table calculation that computes the same result?
A FIXED LOD is calculated earlier in the pipeline at the data level, so it stays stable even if you change the view-only context filters that affect it. A table calculation is computed at the very end, based on what is currently visible in the chart, so it changes with filters, layout, and how fields are arranged.
If you pick the wrong one, your numbers can look off. FIXED may ignore filters you expected it to respect, while table calcs can shift unexpectedly as the view changes.
Q27. How do you optimize a slow Tableau dashboard?
The steps are:
- Cut down the data first: Bring in only what you actually need; fewer rows and columns mean faster dashboards.
- Switch to extracts where possible: They are quicker than live connections, especially with large or slow databases.
- Keep calculations simple: Avoid heavy or repeated logic; simplify formulas and reuse fields instead of recalculating.
- Do not overload the dashboard: Too many charts or sheets can slow things down, so keep only what adds value.
- Be smart with filters: Reduce high-cardinality filters and use context filters to control how queries run.
- Clean up the data model: Remove unnecessary joins and make sure the structure is efficient.
- Use performance recording: Check where time is being spent and fix the exact parts causing the slowdown.
Q28. What is data blending vs a cross-database join, and when would you use each?
Data blending combines data from different sources at the chart level, matching them on a common field while keeping each source separate. It is used when the data lives in different systems or cannot be physically joined.
Cross-database join physically merges tables from different databases into one dataset before analysis, like a normal join. Use it when you need row-level detail, consistent calculations, and better performance for deeper analysis across sources.
Q29. What is a published data source in Tableau Server, and why would you use it?
A published data source in Tableau Server is a shared, ready-to-use dataset stored centrally, so all users connect to the same version of the data. It is used to keep reporting consistent across teams and to avoid each person rebuilding or cleaning the same data separately.
Q30. How do you handle row-level security in Tableau?
Row-level security is set up in two ways: User Filters or Data Source Filters. User Filters control what each person sees based on their login, so, for example, a sales manager only sees their own region’s data. Data Source Filters apply a fixed rule to everyone, like restricting the dataset so that all users only see UK sales data.
Q31. What is the difference between a Tableau extract (.hyper file) and a live connection in terms of performance and use cases?
A Tableau extract (.hyper) is a compressed, in-memory snapshot of data. It is faster since queries run on optimized local data instead of hitting the source every time. The trade-off is that extracts can become outdated unless refreshed, while live connections always show real-time data but can be slower since they depend on the performance of the source system.
Use extracts for speed and stable reporting, and choose a live connection when you need up-to-the-minute data or direct access to constantly changing systems.
Q32. How does Tableau connect to a data warehouse like Snowflake or Redshift?
Tableau connects to platforms like Snowflake or Redshift through built-in connectors that run SQL queries in the background to fetch data. This setup is often discussed in data modeling interview questions, as it highlights how data flows between systems and how it’s structured for analysis. You can use a live connection for real-time data or an extract for faster dashboard performance, while Tableau Prep is used earlier in the process to clean and organize the data before it reaches Tableau or the data warehouse.
Q33. What is the Tableau Order of Operations and why does it matter?
The order of expression processes filters and calculates since every step changes the data that the succeeding step works on. If a wrong assumption is applied to this sequence, the results can look correct in the chart but still be logically wrong.
Tableau Order of Operations:
- Extract Filters
- Data Source Filters
- Context Filters
- FIXED LOD Expressions
- Dimension Filters
- Measure Filters
- Table Calculation Filters
- Final view of what is displayed
Q35. How would you build a dashboard that lets a business user explore sales data by region, product, and time period without being a Tableau user themselves?
The steps are:
- First, figure out what the business user actually wants to answer: like which regions are doing well, which products are selling, and how sales change over time, so the dashboard is built around real questions, not just charts.
- Connect Tableau to a clean, reliable dataset where fields like region, product, and date are consistent, so users don’t get confused or run into messy data.
- Create a few clear visuals like a region comparison chart, product breakdown, and a sales trend line that are easy to read without needing any Tableau knowledge.
- Add simple filters and click interactions so users can explore by region, product, or time just by selecting options on the screen.
- Keep the layout clean and intuitive, with clear labels and helpful tooltips, so a non-technical user can explore insights on their own without guidance.
Tableau Performance and Troubleshooting Questions
This section presents tableau interview questions and answers asked in senior-level interviews and at tech companies where dashboards serve thousands of users.
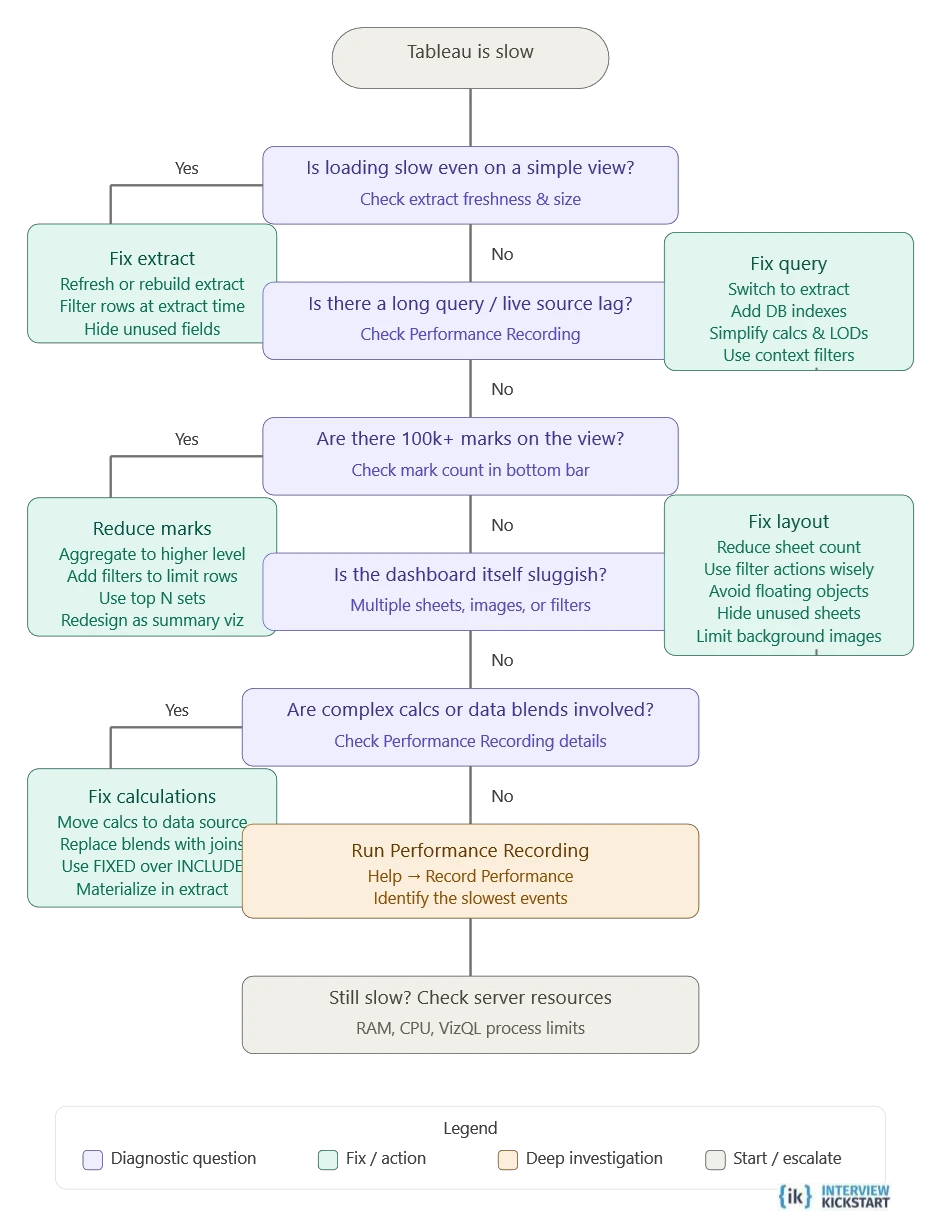
The following figure presents the Tableau performance troubleshooting flowchart decision tree.
Q36. A dashboard that worked fine last month is now loading slowly. Walk me through how you would diagnose it.
The steps are:
- Reproduce the issue and confirm the speed, using Performance Recording in Tableau Desktop to capture load time details.
- Check if the data volume has grown since last month by reviewing the extract refresh history or source tables.
- Review recent workbook changes, new fields, joins, and filters with version history on Tableau Server.
- Run Performance Recording and identify which step, query, layout, or rendering is taking the most time.
- Review the data connection type and query performance, using database logs to spot slow queries.
- Examine filters, especially high-cardinality or context filters, that might be increasing query load.
- Check calculations like LODs or table calculations to see if they are heavier or more complex.
- Review the dashboard layout for too many sheets, marks, or dense visuals slowing rendering.
- Monitor server resource usage, CPU, and memory via admin views in Tableau Server.
- Open individual sheets separately to isolate and pinpoint the exact source of the slowdown.
Q37. A calculated field is returning unexpected results. What do you check?
The following checks are run:
- Start by checking the formula and ensuring the logic and aggregations like SUM vs AVG are doing exactly what you expect in Tableau Desktop.
- Then confirm the level of detail, ensuring the calculation runs at the right granularity compared to what’s shown in the view.
- Look at the filters next, especially their order, since they can quietly change the numbers being calculated.
- Finally, check the raw data for issues like nulls, duplicates, or joins that might be feeding incorrect inputs.
Q38. Your extract refresh is failing on Tableau Server. What do you do?
The following steps are recommended:
- Start by opening the refresh history in Tableau Server and reading the exact error, and it usually points you in the right direction.
- Check the connection next, ensure credentials have not expired, and that the database is reachable.
- Look at what changed recently, like schema updates or a spike in data volume that might break the extract.
- After fixing the issue, trigger a manual refresh in Tableau Desktop or Server to confirm it runs cleanly.
Q39. A business user says the numbers in the Tableau dashboard do not match what they see in the raw Excel file. What do you investigate?
The steps are:
- Start with filters, since the dashboard in Tableau Desktop has date or category filters applied that are not obvious in the Excel view.
- Check how numbers are being aggregated: SUM, AVG, or COUNT in Tableau may not match how the Excel totals are calculated.
- Review any transformations like joins, calculated fields, or cleaned columns that could be altering the data.
- Confirm both sources are in sync, an outdated extract in Tableau versus a newer Excel file can easily cause mismatches.
Q40. Your Tableau dashboard has 15 worksheets and takes 45 seconds to load. What would you do?
The steps are:
- Identify bottlenecks using Performance Recording to pinpoint slow queries, calculations, or rendering steps.
- Reduce data volume by limiting rows/columns, applying extract filters, or aggregating data where possible.
- Switch from live connection to extracts (.hyper) to improve query speed and dashboard responsiveness.
- Optimize calculations by simplifying formulas, minimizing LODs/table calcs, and avoiding repeated logic.
- Minimize dashboard complexity by reducing the number of worksheets, marks, and high-cardinality filters.
- Optimize data model by removing unnecessary joins, using context filters strategically, and ensuring efficient relationships.
Q41. How do you test a Tableau dashboard before publishing it to Tableau Server?
The steps are:
- First, ensure that the numbers are right, cross-check key metrics with the original data, and verify filters, joins, and that calculations are not distorting results.
- Next, click through the dashboard like an end user, test filters, parameters, drill actions, and tooltips to ensure everything works smoothly.
- Finally, look at speed and design, check if views load quickly, fix any lag, and confirm the layout is clean and easy to use across screens.
Quick Reference – Tableau Concepts Every Interviewer Tests
A cheat sheet for Tableau concepts reference table is given below:
| Concept | Simple Definition | Why Interviewers Ask About It |
|---|---|---|
| Dimension | Descriptive fields like Region or Product that help you break data into categories | To check if you understand how data is grouped in a dashboard |
| Measure | Numeric values like Sales or Profit that can be summed or averaged | To see if you know how Tableau handles numbers and aggregations |
| Live Connection | A direct link to the data source that always shows the latest data | To understand if you know when real-time data is needed despite slower performance |
| Extract (.hyper) | A stored snapshot of data that improves dashboard speed | To test if you can balance performance with data freshness |
| LOD Expression | Lets you control how data is calculated, even outside what’s shown in the view | To evaluate your ability to handle more advanced calculations |
| Context Filter | A primary filter that other filters depend on and run after | To check your understanding of filter order and performance impact |
| Calculated Field | A new field you create using formulas in Tableau | To confirm you can derive useful insights from raw data |
| Table Calculation | A calculation done on the data already visible in the chart | To see if you understand calculations that happen after aggregation |
| Parameter | A user input that can change values, filters, or logic dynamically | To test how you make dashboards interactive |
| Data Blending | Combining data from different sources inside a view using a common field | To check how you handle multiple data sources without joins |
| .twbx | A packaged file that includes the workbook and its data | To confirm you know how to share work without missing dependencies |
| Publish to Server | Uploading your dashboard to Tableau Server for others to access | To assess your understanding of sharing, collaboration, and deployment |
Conclusion
The Tableau interview questions and answers 2026 guide examined several topics for beginners, intermediate, and senior levels. Tableau interview questions focus on the theory and hands-on use of the application to solve business problems.
To prepare for interview questions in Tableau, read about the various features and functionalities, and use cases of business problems that were solved. Download the trial version, read the documentation, and blogs on how organizations use Tableau.
Register for reputed interview courses such as Interview Kickstart, take mock interviews, and prepare.
FAQs: Tableau Interview Questions
Q1. What are the most important topics to prepare for Tableau interview questions?
Focus on core areas like filters, joins vs blending, LOD expressions, calculated fields, parameters, dashboard optimization, and performance tuning, as these are commonly tested.
Q2. How can I practice Tableau interview questions effectively?
Work on real datasets, build dashboards, solve business problems, and practice mock interviews to strengthen both conceptual understanding and practical skills.
Q3. Are Tableau interview questions different for freshers and experienced professionals?
Yes, beginners are usually asked basic concepts, while experienced candidates face advanced questions on optimization, architecture, and real-world problem-solving.
Q4. Do Tableau interviews include SQL or Python questions?
Yes, many roles expect knowledge of SQL for data extraction and sometimes Python for data processing or integration with Tableau workflows.
Q5. How important is hands-on experience for Tableau interview questions?
Hands-on experience is critical, as interviewers often assess how well you can apply concepts to real scenarios rather than just explain theory.
References
Recommended Reads:
- SQL Interview Questions and Answers for Experienced Professionals 2026: Process, Domains & Prep Guide
- 35 Data Modeling Interview Questions and Answers (2026)
- 60+ Uber Data Engineer Interview Questions
- Top Database Questions to Ace Your Technical Interview
- Python Data Structures Interview Questions and Answers 2026: Process, Domains & Prep Guide